Introduction
In Azure data orchstration, ensuring the efficient transfer of data between systems is crucial. This is where Azure Data Factory (ADF) and Azure Synapse Analytics shine. Recently, I had to perform analysis on a misbehaving copy activity in ADF. I figured I’d provide my query here as a form of my repeated attemps at D-R-Y
For this example the pipeline is named Copy My Data, leverages a self-hosted integration runtime to demostrate addtional filtering in the query
In this blog post, I’ll demonstrate how to monitor and analyze the performance of this ADF pipeline, focusing on the ADF copy activity. We’ll utilize the ADFActivityRun logs and Kusto Query Language (KQL) to extract meaningful insights and ensure our data processes are running efficiently.
Problem
Effective monitoring of ADF pipelines is essential for identifying performance bottlenecks, ensuring data accuracy, and maintaining overall system health. Specifically, we need to track key metrics such as the number of rows copied, the SQL query executed, and the duration of each activity. This information helps in optimizing pipeline performance and troubleshooting issues promptly.
Solution
ADF Pipeline
Our ADF pipeline, Copy My Data, is designed to copy data from a SQL Server to a Data Lake. The pipeline is parameterized for flexibility and uses a self-hosted integration runtime for improved data transfer performance. Here’s a brief overview of the pipeline structure:
- Source: SQL Server
- Destination: Data Lake
- Integration Runtime: Self-hosted
To monitor this pipeline’s performance, we’ll use KQL to query the ADFActivityRun logs. These logs provide detailed information about each activity run, including status, duration, and data metrics.
Monitoring with KQL
Below is the KQL query we use to extract performance data for our Copy My Data pipeline:
ADFActivityRun
| where TimeGenerated > ago(30d) // last 30 days
| where ActivityType == "Copy" // ADF copy activity
| where ActivityName == "Copy My Data" // pipeline
| extend total_rows = parse_json(Output).rowsCopied,
sql_query = tostring(parse_json(tostring(parse_json(Input).source)).sqlReaderQuery),
Duration = End - Start // parse some json columns
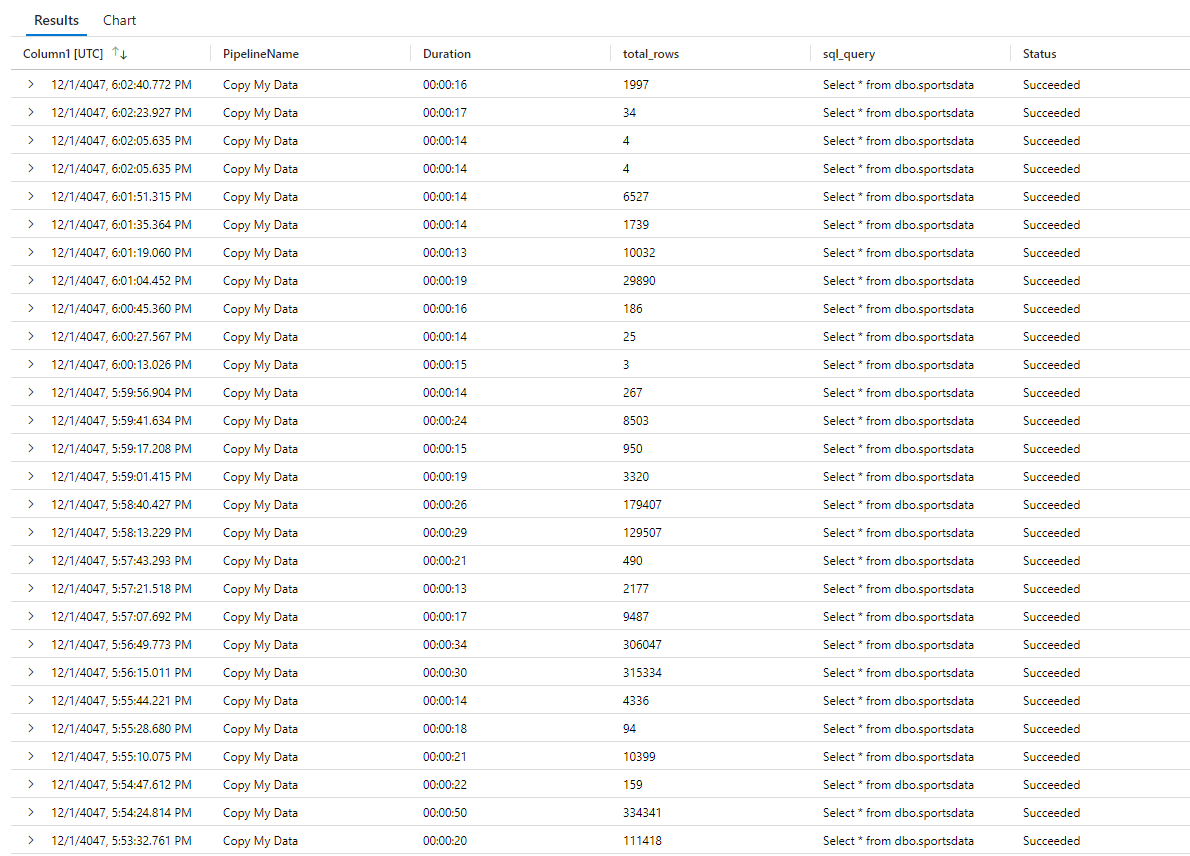
| project TimeGenerated, PipelineName, Start, End, Duration, total_rows, sql_query, Status // select these columns
| where Status in ("Succeeded", "TimedOut") // where finished, it logs queued and in-progress rows which are not meaningful for this
| where Duration <> '00:00:01' // Skipped activities show as success with length of 1 second
//| where sql_query == "select * from dbo.Adventureworks_sales" // choose a table that has timed out
//| where EffectiveIntegrationRuntime == "MY-Self_hosted-IR" // Target a sepecfic IROutput
Key Steps in the Query
- Filter by Time Range: We filter the logs to the last 30 days.
- Filter by Activity Type and Name: We focus on the “Copy” activities specific to the Copy My Data pipeline.
- Extract Metrics: Using
extend, we parse the JSON output to extracttotal_rows,sql_query, andDuration. - Select Relevant Columns: We project the necessary columns for analysis:
TimeGenerated,PipelineName,Start,End,Duration,total_rows,sql_query, andStatus. - Filter by Status and Duration: We only consider activities that succeeded or timed out, and exclude any activities with a duration of 1 second (indicating a skipped activity).
Additional Filters
For more granular insights, consider the following additional filters:
Filter by Specific SQL Query:
| where sql_query contains "TABLE"Filter by Intergration Runtime Used in the Copy:
| where EffectiveIntegrationRuntime == "MY-Self_hosted-IR"Filter by Specific Status:
| where Status == "Succeeded"
Extending Insights with Average Durations
To further enhance our monitoring, we can summarize key metrics. This allows us to track performance trends and identify anomalies quickly. Below is the extension of our KQL query to include summary statistics:
| summarize AverageDuration = avg(Duration),
            MaxDuration = max(Duration),
            P90Duration = percentile(Duration, 90),
            P99Duration = percentile(Duration, 99)
            by PipelineName
| order by PipelineName
Example
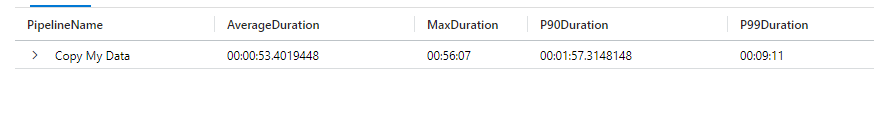
Key Summary Metrics
- AverageDuration: The average duration of the copy activities.
- MaxDuration: The maximum duration observed.
- P90Duration: The 90th percentile duration, indicating that 90% of the activities took less time than this value.
- P99Duration: The 99th percentile duration, providing an insight into the upper range of activity durations.
These metrics could be visualized in Power BI to monitor the performance trends over time, helping to quickly identify and address any performance issues.
Conclusion
Hope that helps! One day I might actually write something about what good monitoring looks like and how I would do it. I just need the time :-)
Code
ADFActivityRun
| where TimeGenerated > ago(30d) // last 30 days
| where ActivityType == "Copy" // ADF copy activity
| where ActivityName == "Copy My Data" // pipeline
| extend total_rows = parse_json(Output).rowsCopied,
         sql_query = tostring(parse_json(tostring(parse_json(Input).source)).sqlReaderQuery),
         Duration = End - Start // parse some json columns
| project TimeGenerated, PipelineName, Start, End, Duration, total_rows, sql_query, Status // select these columns
| where Status in ("Succeeded", "TimedOut") // where finished, it logs queued and in-progress rows which are not meaningful for this
| where Duration <> '00:00:01' // Skipped activities show as success with length of 1 second
//| where sql_query == "select * from dbo.Adventureworks_sales" // choose a table that has timed out
//| where EffectiveIntegrationRuntime == "MY-Self_hosted-IR" // Target a sepecfic IR
| summarize AverageDuration = avg(Duration),
            MaxDuration = max(Duration),
            P90Duration = percentile(Duration, 90),
            P99Duration = percentile(Duration, 99)
            by PipelineName
| order by PipelineName
Incorporating these monitoring techniques into your ADF workflows will help you achieve better performance and reliability, ensuring your data processes run smoothly and efficiently.